Overview
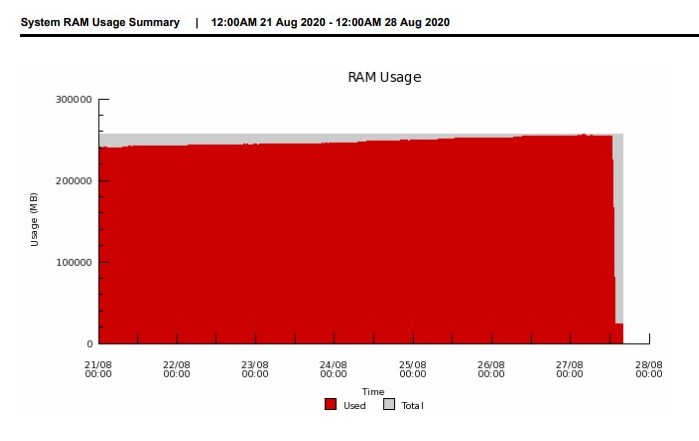
If RAM utilization is slowly creeping up, Exinda may change the Interfaces' status to bypass mode.
In dmesg logs, you may see the following entries:
  br30: port 2(eth31) entered forwarding state
  kernel: bpmod: eth31 is in the Bypass mode now; WDT has expired.
While executing en and show process sort memory commands from the CLI to check which process is using up the RAM, the statisticsd is listed as a top-process.
Solution
A workaround to free up the RAM would be to restart the statisticsd process. It's recommended to create a scheduled cronjob to restart the process on a daily or weekly basis, depending on your RAM consumption.
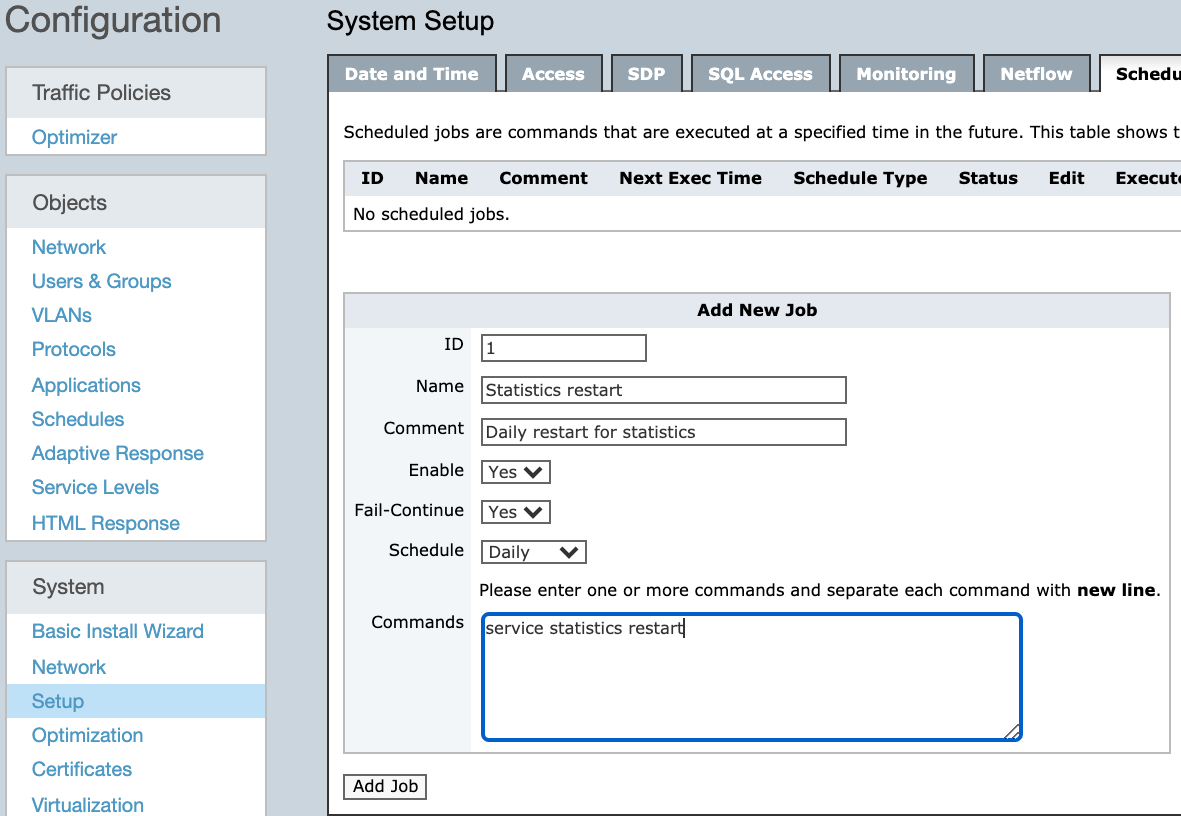
- In Exinda WebUI, navigate to Configuration > System > Setup > Scheduled Jobs tab.
- Fill out the necessary details and as a command specify
service statistics restart:
- Click Add Job. Modify the Time of execution if needed.
Important Notes
If you see collectord consuming RAM as well, an identical "service collector restart" cronjob can be created.
Enormous RAM consumption can also be caused by a huge number of connections hitting the Exinda appliance. The logs will show the following errors:
  kernel: nf_conntrack: expectation table full
  kernel: net_ratelimit: 413 callbacks suppressed
Verify your Exinda device's current connection values in Monitoring and make sure they are not over the designed specs limits.
Priyanka Bhotika
Comments