Overview
A user would like to know the OID of specific SNMP alerts or status for constant Exinda monitoring. This includes monitoring of Free RAM or Optimizer current rate, etc.
PRTG Network Monitor was already connected successfully.
This article details the process of finding the OIDs by exporting and reviewing the Exinda MIB file. Additionally, the OID reference is available below.
Solution
-
Install the Paessler MIB Importer Application for Windows or MIB browser for Mac.
-
Log in to the Exinda Web UI.
-
Navigate to System > Network > SNMP > Click on the Download SNMP MIB icon to download the text MIB file.
-
Open the MIB Importer or MIB browser app.
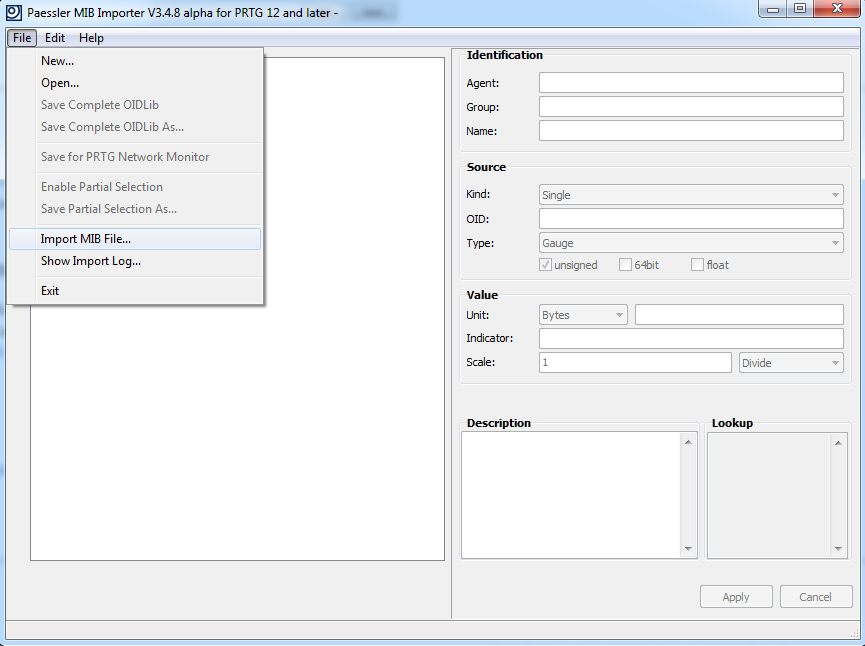
- Import Exinda MIB file:
-
For Windows: Navigate to File > Import MIB File and select the text MIB file downloaded in Step-3.
- For Mac: Navigate to File > Load MIBs and select the text MIB file downloaded in Step-3.
-
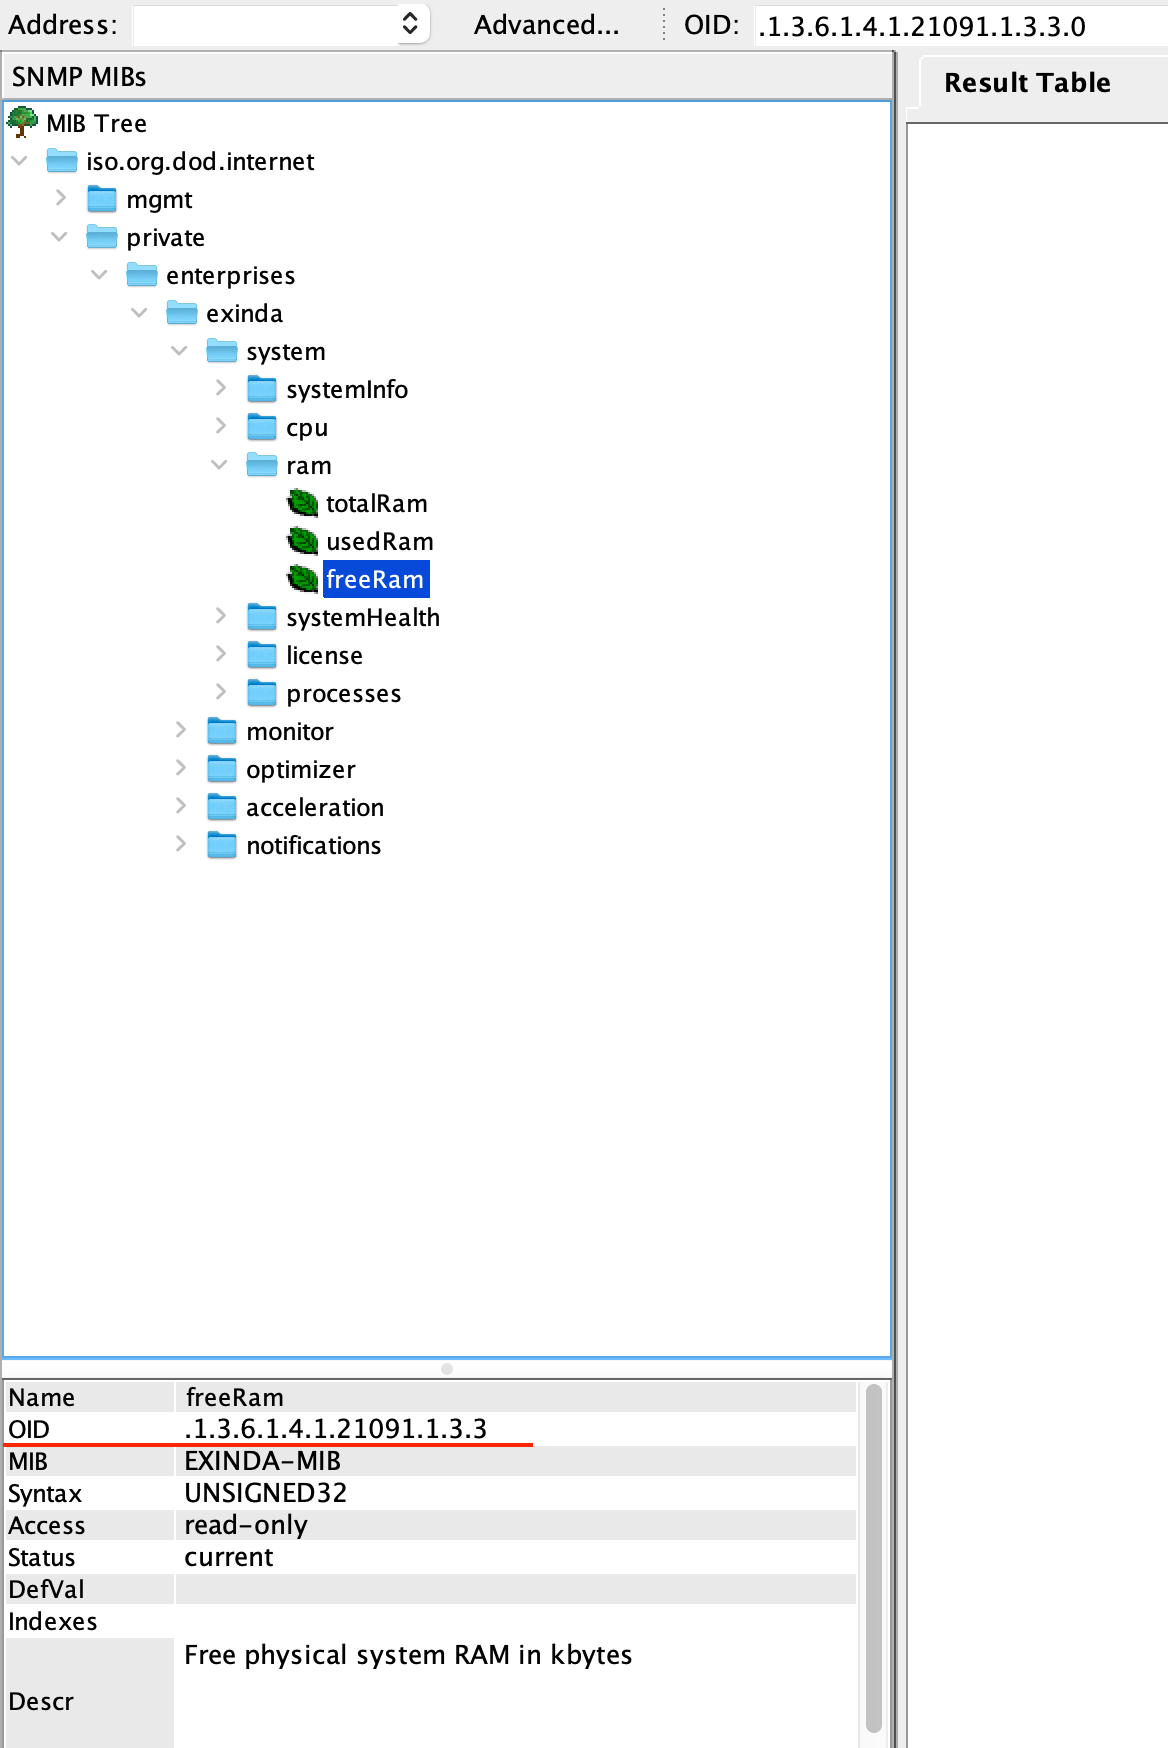
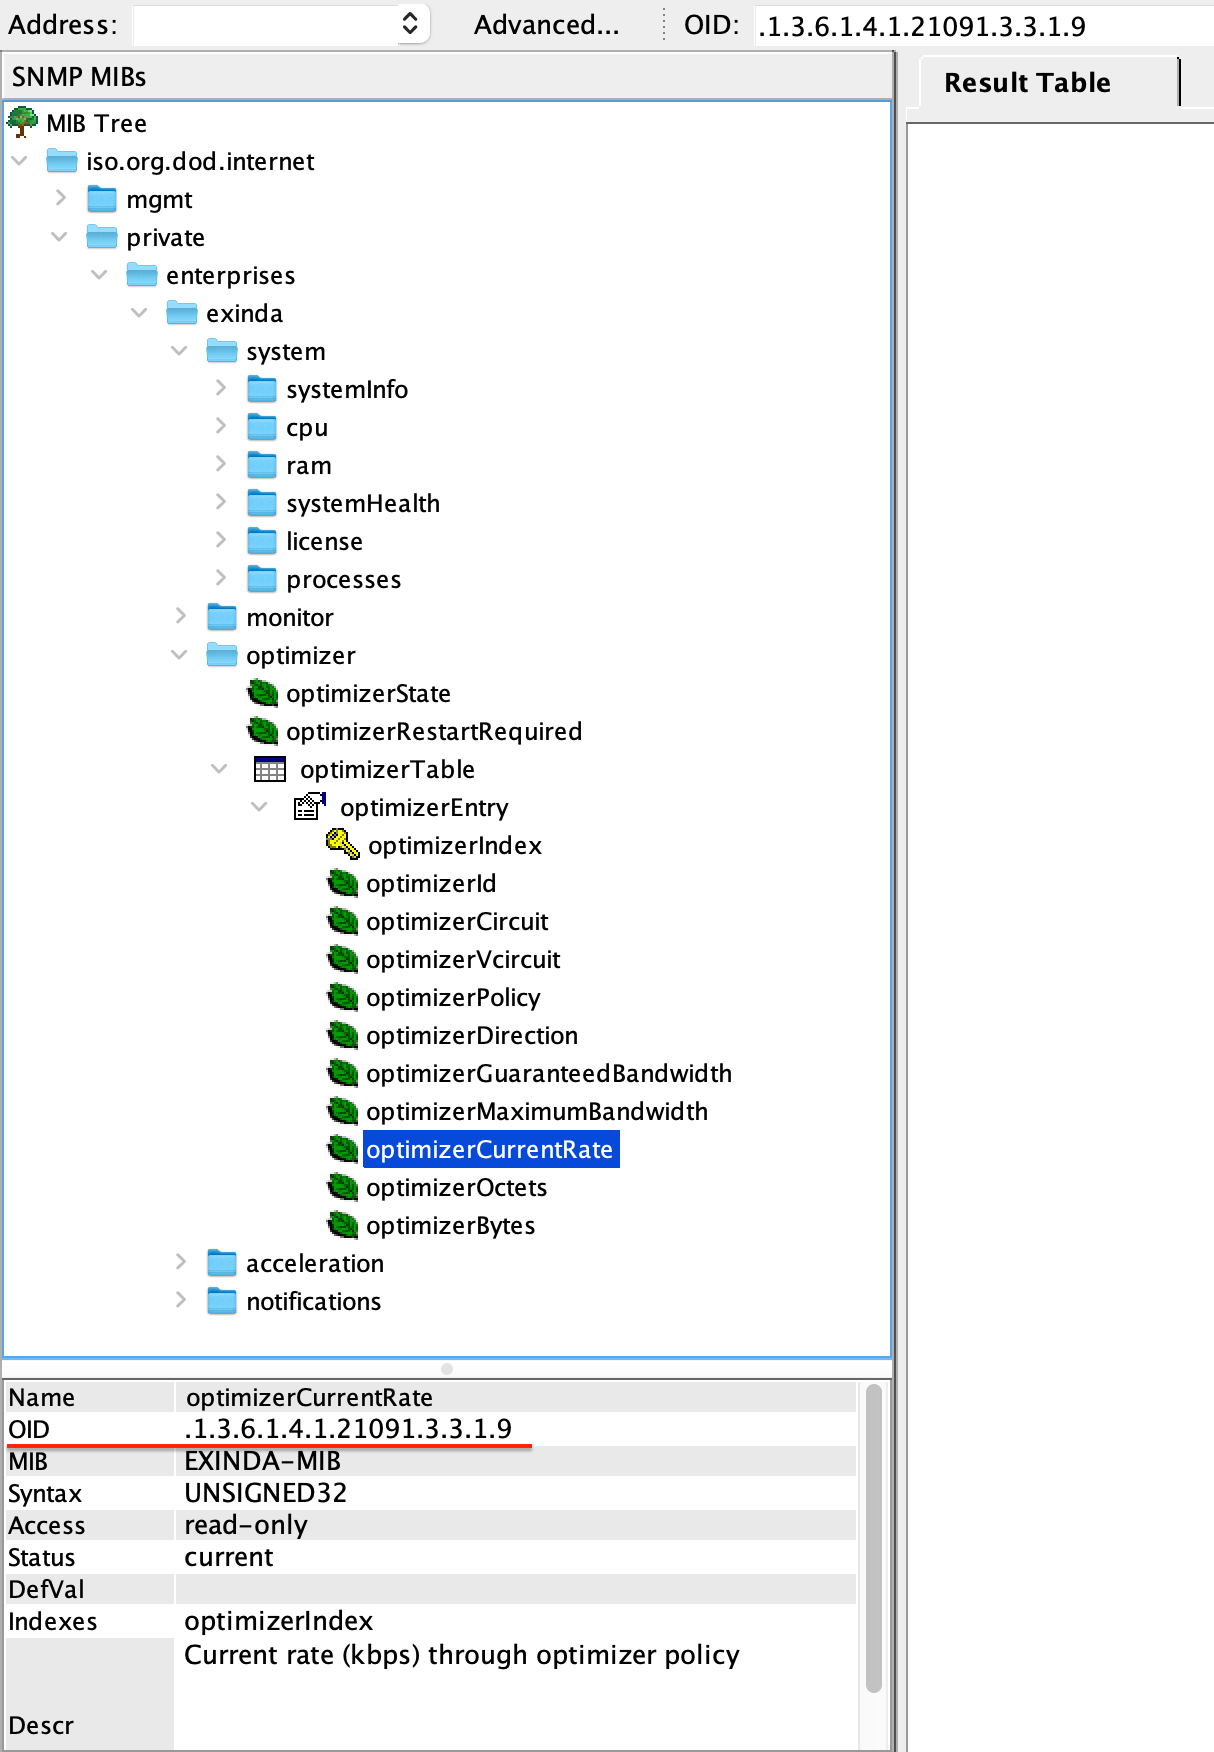
- This will show you all the alerts available as of now when you click on one of them, which shows you the OID for each alert. For example,
OID for free RAM Optimizer current rate

OID reference
A table with all the OIDs related to Exinda alerts that can be queried through SNMP has been provided below for reference:
| Group | Name | OID |
| cifs acceleration | cifs concurrent accelerated connections | 1.3.6.1.4.1.21091.4.4.6.0 |
| cifs acceleration | cifs concurrent connections | 1.3.6.1.4.1.21091.4.4.5.0 |
| cifs acceleration | cifs concurrent signed connections | 1.3.6.1.4.1.21091.4.4.7.0 |
| cifs acceleration | cifs enabled | 1.3.6.1.4.1.21091.4.4.1.0 |
| cifs acceleration | cifs read ahead | 1.3.6.1.4.1.21091.4.4.2.0 |
| cifs acceleration | cifs transaction acceleration | 1.3.6.1.4.1.21091.4.4.4.0 |
| cifs acceleration | cifs write ahead | 1.3.6.1.4.1.21091.4.4.3.0 |
| cpu | cpu load1 | 1.3.6.1.4.1.21091.1.2.1.0 |
| cpu | cpu load15 | 1.3.6.1.4.1.21091.1.2.3.0 |
| cpu | cpu load5 | 1.3.6.1.4.1.21091.1.2.2.0 |
| cpu | cpu temperature | 1.3.6.1.4.1.21091.1.2.5.0 |
| cpu | cpu usage percent | 1.3.6.1.4.1.21091.1.2.4.0 |
| exinda community | community state | 1.3.6.1.4.1.21091.4.1.1.0 |
| license | hardware assistedl7 | 1.3.6.1.4.1.21091.1.5.8.0 |
| license | licensed | 1.3.6.1.4.1.21091.1.5.1.0 |
| license | max acceleration bandwidth | 1.3.6.1.4.1.21091.1.5.6.0 |
| license | max acceleration connections | 1.3.6.1.4.1.21091.1.5.7.0 |
| license | max apm objects | 1.3.6.1.4.1.21091.1.5.17.0 |
| license | max aps objects | 1.3.6.1.4.1.21091.1.5.11.0 |
| license | max bandwidth | 1.3.6.1.4.1.21091.1.5.3.0 |
| license | max connection rate | 1.3.6.1.4.1.21091.1.5.5.0 |
| license | max connections | 1.3.6.1.4.1.21091.1.5.4.0 |
| license | max num of edge cache connection | 1.3.6.1.4.1.21091.1.5.22.0 |
| license | max optimizer policies | 1.3.6.1.4.1.21091.1.5.10.0 |
| license | max pdf reports | 1.3.6.1.4.1.21091.1.5.13.0 |
| license | max sla objects | 1.3.6.1.4.1.21091.1.5.12.0 |
| license | optimizer licensed | 1.3.6.1.4.1.21091.1.5.21.0 |
| license | optimizer licensed depr | 1.3.6.1.4.1.21091.1.5.9.0 |
| license | ss expiry | 1.3.6.1.4.1.21091.1.5.2.0 |
| license | ssl acceleration licensed | 1.3.6.1.4.1.21091.1.5.18.0 |
| license | ssl acceleration licensed depr | 1.3.6.1.4.1.21091.1.5.14.0 |
| license | virtualization licensed | 1.3.6.1.4.1.21091.1.5.19.0 |
| license | virtualization licensed depr | 1.3.6.1.4.1.21091.1.5.15.0 |
| license | web cache licensed | 1.3.6.1.4.1.21091.1.5.20.0 |
| license | web cache licensed depr | 1.3.6.1.4.1.21091.1.5.16.0 |
| monitor | collector status | 1.3.6.1.4.1.21091.2.1.0 |
| optimizer | optimizer restart required | 1.3.6.1.4.1.21091.3.2.0 |
| optimizer | optimizer state | 1.3.6.1.4.1.21091.3.1.0 |
| ram | free ram | 1.3.6.1.4.1.21091.1.3.3.0 |
| ram | total ram | 1.3.6.1.4.1.21091.1.3.1.0 |
| ram | used ram | 1.3.6.1.4.1.21091.1.3.2.0 |
| smbv1acceleration | smbv1enabled | 1.3.6.1.4.1.21091.4.6.1.0 |
| smbv1acceleration | smbv1meta cache | 1.3.6.1.4.1.21091.4.6.4.0 |
| smbv1acceleration | smbv1prefetch bytes | 1.3.6.1.4.1.21091.4.6.5.0 |
| smbv1acceleration | smbv1read ahead | 1.3.6.1.4.1.21091.4.6.2.0 |
| smbv1acceleration | smbv1write behind | 1.3.6.1.4.1.21091.4.6.3.0 |
| system health | cpu alarm | 1.3.6.1.4.1.21091.1.4.1.0 |
| system health | disk alarm | 1.3.6.1.4.1.21091.1.4.3.0 |
| system health | nic alarm | 1.3.6.1.4.1.21091.1.4.4.0 |
| system health | ram alarm | 1.3.6.1.4.1.21091.1.4.2.0 |
| system info | config name | 1.3.6.1.4.1.21091.1.1.6.0 |
| system info | config unsaved changes | 1.3.6.1.4.1.21091.1.1.7.0 |
| system info | hardware series | 1.3.6.1.4.1.21091.1.1.1.0 |
| system info | licensed model | 1.3.6.1.4.1.21091.1.1.2.0 |
| system info | system host id | 1.3.6.1.4.1.21091.1.1.4.0 |
| system info | system time zone | 1.3.6.1.4.1.21091.1.1.8.0 |
| system info | system uptime | 1.3.6.1.4.1.21091.1.1.5.0 |
| system info | system version | 1.3.6.1.4.1.21091.1.1.3.0 |
| tcp acceleration | tcpa congestion control | 1.3.6.1.4.1.21091.4.2.1.0 |
| tcp acceleration | tcpa connections current | 1.3.6.1.4.1.21091.4.2.5.0 |
| tcp acceleration | tcpa connections new | 1.3.6.1.4.1.21091.4.2.9.0 |
| tcp acceleration | tcpa connections peak | 1.3.6.1.4.1.21091.4.2.7.0 |
| tcp acceleration | tcpa discovery | 1.3.6.1.4.1.21091.4.2.10.0 |
| tcp acceleration | tcpa dual bridge bypass | 1.3.6.1.4.1.21091.4.2.12.0 |
| tcp acceleration | tcpa transport mode | 1.3.6.1.4.1.21091.4.2.2.0 |
| tcp acceleration | tcpa window scale | 1.3.6.1.4.1.21091.4.2.13.0 |
| wan memory | wm compression | 1.3.6.1.4.1.21091.4.3.1.0 |
| wan memory | wm disk size | 1.3.6.1.4.1.21091.4.3.4.0 |
| wan memory | wm disk used | 1.3.6.1.4.1.21091.4.3.5.0 |
| wan memory | wm disk used percent | 1.3.6.1.4.1.21091.4.3.6.0 |
| wan memory | wm persistence | 1.3.6.1.4.1.21091.4.3.3.0 |
| wan memory | wm receive bytes in | 1.3.6.1.4.1.21091.4.3.10.0 |
| wan memory | wm receive bytes out | 1.3.6.1.4.1.21091.4.3.11.0 |
| wan memory | wm receive reduction percent | 1.3.6.1.4.1.21091.4.3.12.0 |
| wan memory | wm send bytes in | 1.3.6.1.4.1.21091.4.3.7.0 |
| wan memory | wm send bytes out | 1.3.6.1.4.1.21091.4.3.8.0 |
| wan memory | wm send reduction percent | 1.3.6.1.4.1.21091.4.3.9.0 |
| wan memory | wm small matcher | 1.3.6.1.4.1.21091.4.3.2.0 |
| wan memory new | wm compression | 1.3.6.1.4.1.21091.4.5.1.0 |
| wan memory new | wm disk size | 1.3.6.1.4.1.21091.4.5.4.0 |
| wan memory new | wm disk used | 1.3.6.1.4.1.21091.4.5.5.0 |
| wan memory new | wm disk used percent | 1.3.6.1.4.1.21091.4.5.6.0 |
| wan memory new | wm persistence | 1.3.6.1.4.1.21091.4.5.3.0 |
| wan memory new | wm receive bytes in | 1.3.6.1.4.1.21091.4.5.10.0 |
| wan memory new | wm receive bytes out | 1.3.6.1.4.1.21091.4.5.11.0 |
| wan memory new | wm receive reduction percent | 1.3.6.1.4.1.21091.4.5.12.0 |
| wan memory new | wm send bytes in | 1.3.6.1.4.1.21091.4.5.7.0 |
| wan memory new | wm send bytes out | 1.3.6.1.4.1.21091.4.5.8.0 |
| wan memory new | wm send reduction percent | 1.3.6.1.4.1.21091.4.5.9.0 |
| wan memory new | wm small matcher | 1.3.6.1.4.1.21091.4.5.2.0 |
Additional Information
If it's needed to have more alerts, please submit a feature request.
Note: currently, in Exinda 7.4.13, there is no feature available to send traps for process crashes. It has been submitted as a feature request.
Priyanka Bhotika
Comments