Overview
Exinda System alerts notify the administrator of any system issues that may require further attention and troubleshooting. If a system alert is raised, the system health status is set to Warning, and an email alert is sent.
This article explains the process of viewing Exinda alert history. It also provides a list of alerts types and their description for you to refer to and understand each alert.
Process
To view the Exinda alert history, please follow the steps below.
- Log into the Exinda appliance.
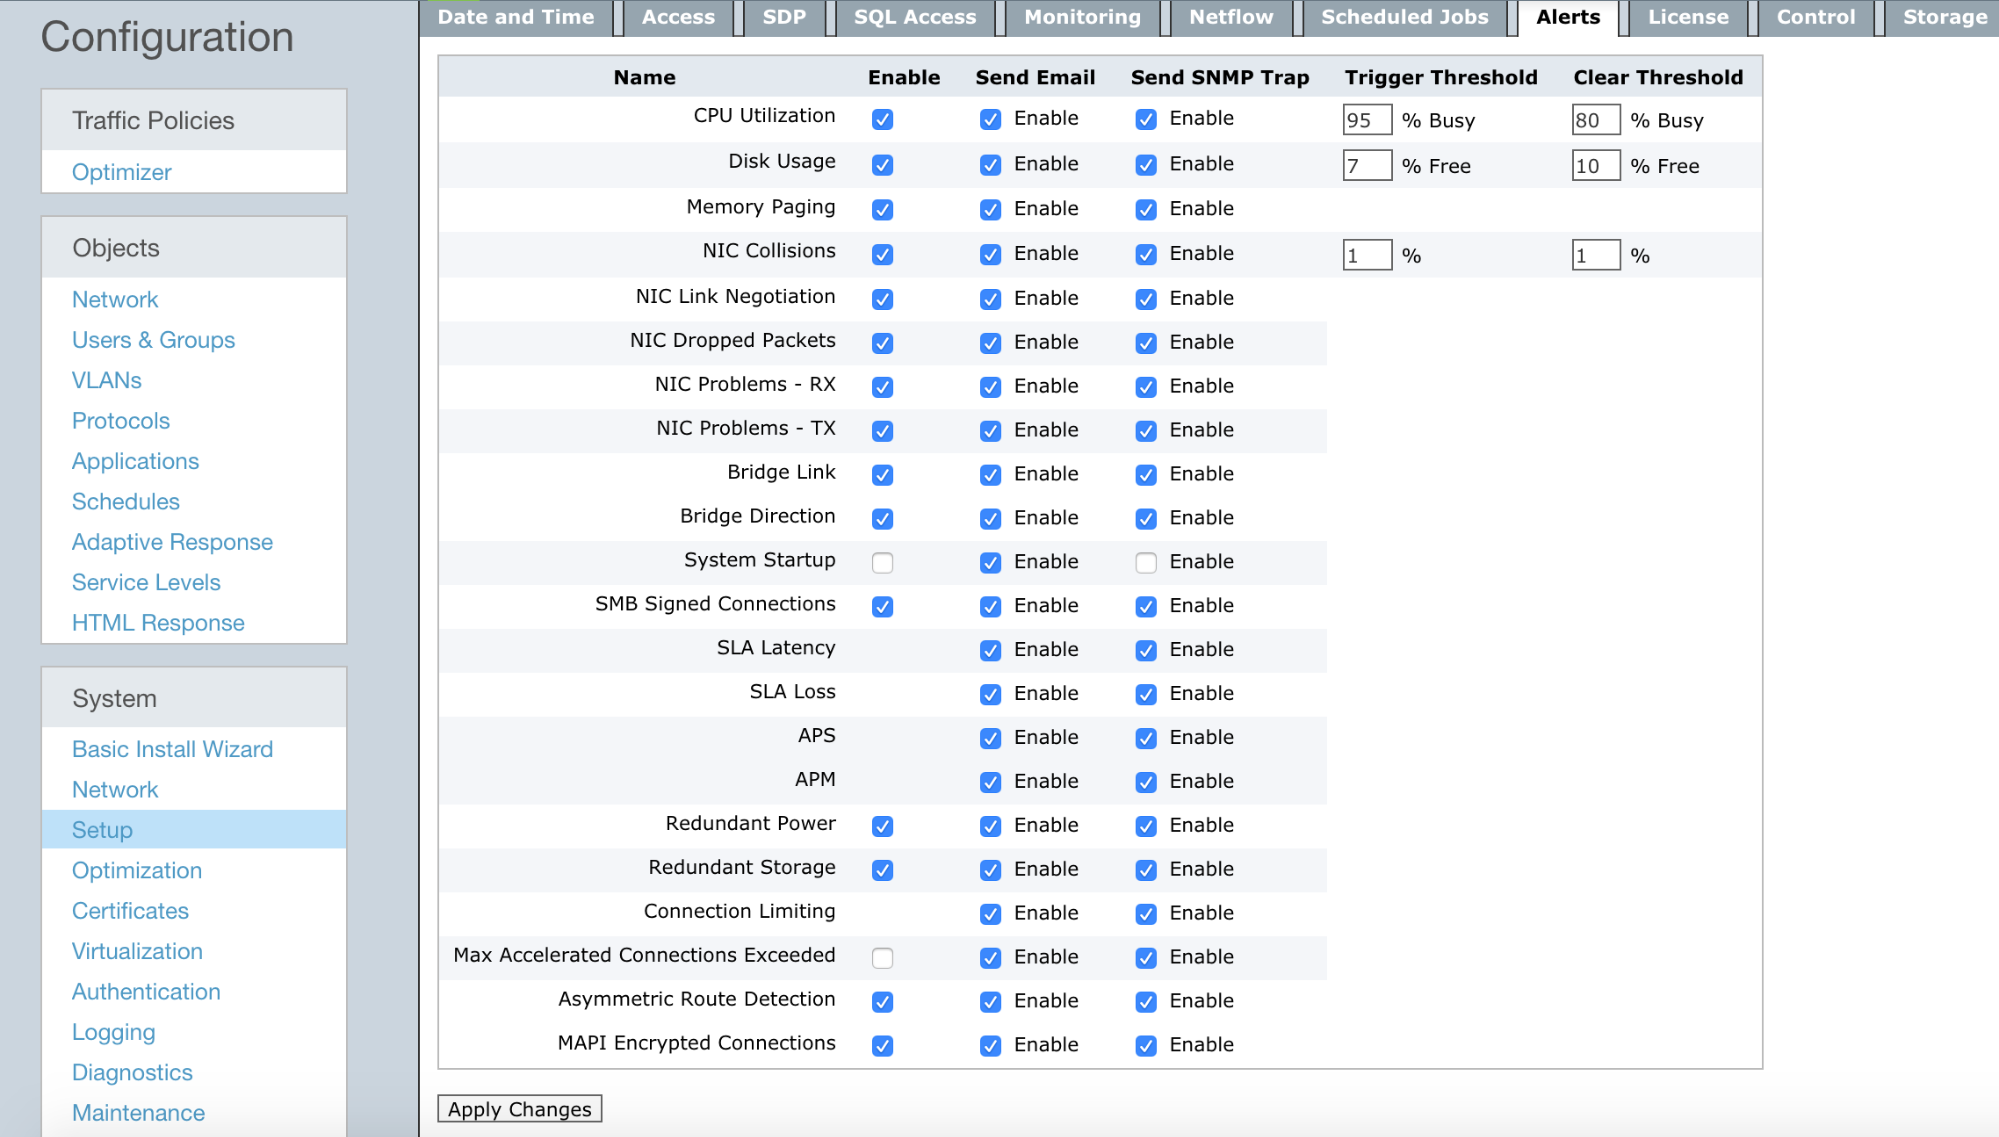
- Click Configuration > System > Diagnostics, and switch to the System tab.
Anything that has generated alerts displays the last time the alert was triggered, and the total number of alerts that have been sent.
- To view the alert that has triggered the warning, click the alarm name. Use the information in this alert to help troubleshoot the issue.
- To remove the history for an alert, click Reset. The system health status is returned to OK.
Alert Types
| Alert Name | Description |
|---|---|
|
CPU Utilization |
Alert raised when the CPU utilization threshold is reached. The trigger and clear thresholds can be altered. The defaults are 95% and 80% busy respectively. |
|
System Disk Full |
Alert raised when the used disk space threshold is reached. The trigger and clear thresholds can be altered. The defaults are 7% and 10% free respectively. |
|
Memory Paging |
Alert for memory use and paging. This means that the data in RAM is swapped to disk. Excessive paging alerts could indicate a system that is running low on RAM resources. Check RAM & SWAP graphs under Monitoring > System. |
|
Bridge Link |
Alert raised when one of the links of an enabled bridge is down. |
|
Bridge Direction |
Alert raised when the appliance cabling is incorrect. In most cases, it indicates the Exinda WAN interface has been incorrectly plugged into the LAN and vice versa. |
|
Link Negotiation |
Alert raised when the speed/duplex on an interface is set to auto, but it is negotiating at half-duplex and 10Mbps. |
|
NIC Problems |
Alert raised when errors are present on the interfaces. |
|
NIC Collisions |
Alert raised when collisions are present on the interfaces. The trigger and clear thresholds can be altered. The defaults are 20 and 1 per 30 sec, respectively. |
|
NIC Dropped packets |
Alert raised when dropped packets are present on the interfaces. |
|
SMB signed connections |
Alert raised when SMB signed connections are present. |
|
Redundant Power |
Alert raised when one of the power supplies fails (only available on platforms with power redundancy). |
|
Redundant Storage |
Alert raised when one of the hard disks fails (only available on platforms with storage redundancy). |
|
Max Accelerated Connections Exceeded |
Alert raised when the number of accelerated connections exceeds the licensed limit. Connections over the licensed limit pass through the appliance and are not accelerated. |
|
Asymmetric Route Detection |
Alert raised when traffic from a single connection comes into the network through one interface or node, and goes out through another interface or node. |
|
MAPI Encrypted Connections |
Alert raised when encrypted MAPI (Messaging Application Programming Interface) traffic to a Microsoft Exchange server is detected on an Exinda Appliance. Encrypted MAPI traffic cannot be accelerated. |
Priyanka Bhotika
Comments