Overview
You are working on creating a dashboard using the Exinda- SQL DB tables to present network information. You see that the data fetched from the tables are old and not showing current, up-to-date information. You want to show correct Application usage for the last 5 minutes, 30 minutes, 1 hour, and 1 day. When you check the Exinda Monitor > Applications dashboard, it does show the correct data.
The dashboard data is being pulled from the stats tables below:
- Stats_application_wan_5min_summary
- Stats_application_wan_30min_summary
- Stats_application_wan_1hour_summary
- Stats_application_wan_1day_summary
Solution
- The correct tables are the flows in the below screenshot.
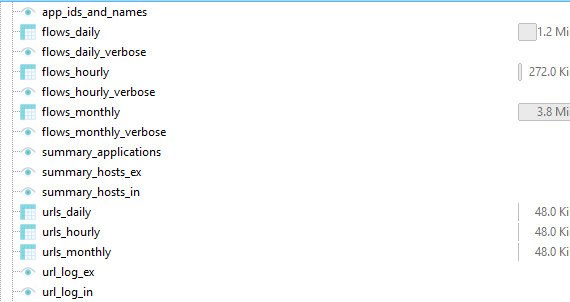
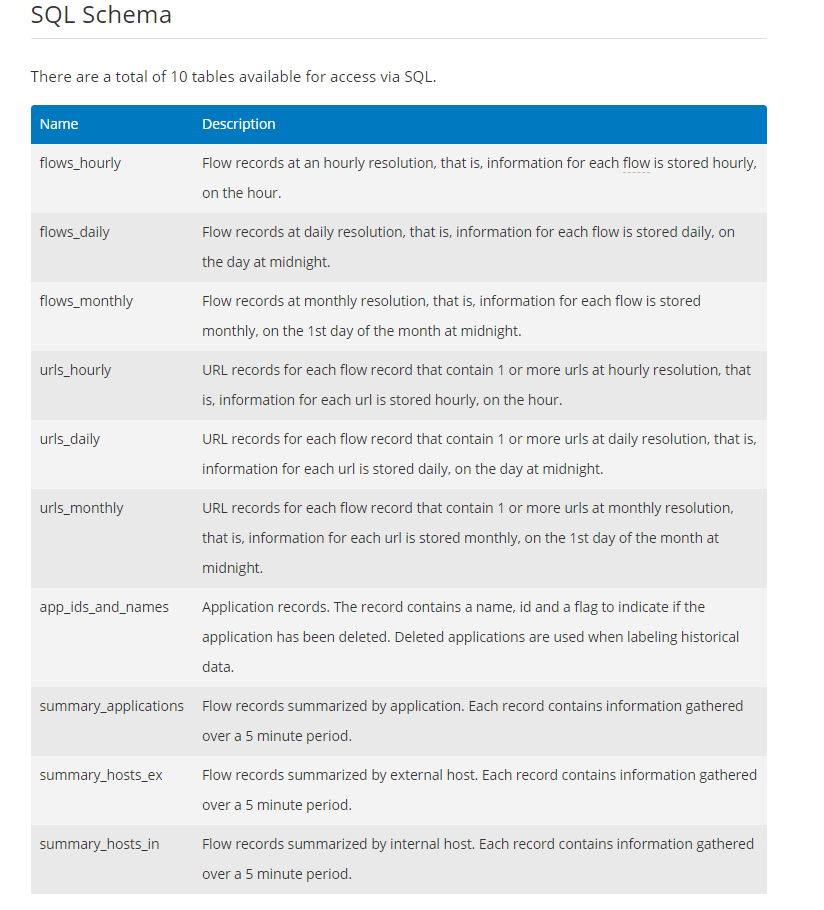
- There are a total of 10 tables available for access via SQL. The application usage data dashboard should pull data from these tables. You can also refer to the SQL Schema documentation for more details.
Testing
The dashboard now pulls updated information and shows current data.
Priyanka Bhotika
Comments